First-Aid Kit
Contents
6. First-Aid Kit#
It’s a pity, but it is impossible to develop applications that work perfectly. Applications always contain errors due to programming mistakes, incorrect use of function calls, or external reasons, such as a missing file or the abnormal termination of an external (non-APL) piece of code.
All these problems may interrupt the normal processing of an application, and require immediate corrective action. The aim of this chapter is to give you the basis to deal with these situations, and work through the experience.
In a later chapter you will see that it is possible to trap and hide unpredictable errors or events, in order to provide a safe environment for the user.
Because APL is an interpreted language, program execution is not aborted, just suspended when an exception occurs. Then the programmer has access to all the application variables, and can diagnose the problem. If they can modify the code or correct some environmental dependency, they may be able to restart the program from the very point it had been interrupted in, until a new exception occurs, and so on. This gives great flexibility when debugging applications.
In this chapter you will learn how to:
interpret error messages;
interpret the information provided by various system indicators;
trace the execution of an application step by step; and
set breakpoints in strategic places to help debugging.
A forgotten comma, an incorrect axis, a missing parenthesis, a scalar where you expected a vector, can all cause an error and it may sometimes be very difficult for a beginner to understand the reason. Try to get help from people who have a better understanding of APL: you will save time and learn a lot from them.
6.1. When an Error Occurs#
6.1.1. Our First Error#
Even when you use a function, that is in itself perfectly correct, errors may occur if you call it with arguments that are not consistent with the function’s requirements. We will use this type of mistake to illustrate what happens when an error occurs.
In the previous chapter we wrote a function to interlace two matrices of the same shape:
∇ r ← x Interlace y; size; even
size ← 1 2×⍴x
r ← size⍴0
even ← 2×⍳(⍴x)[2]
r[;even] ← y
r[;even-1] ← x
∇
(2 2⍴1) (2 2⍴0)
(2 2⍴1) Interlace (2 2⍴0)
This function works perfectly if you stick to its rules, but what happens if you call it with matrices that don’t have the same shape?
6.1.1.1. Your Environment and Indicators#
Let us try to interlace our forecast matrix, that has 4 rows and 6 columns,
⎕RL ← 73
⎕←forecast ← 10×?4 6⍴55
with a 3 by 5 matrix, and see what happens:
forecast Interlace 3 5⍴⍳15
LENGTH ERROR
Interlace[4] r[;even]←y
∧
The first thing we see is the error message that is issued. Then, if you are using RIDE or the Windows interpreter, you will see that, in the lower right corner of the window, some information is highlighted. Fig. 6.1 shows this highlighting in red, for users of the Windows interpreter, and Fig. 6.2 shows this highlighting in purple for users of the RIDE interpreter.
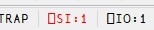
Fig. 6.1 Red highlighting of ⎕SI upon reaching an error in the Windows interpreter.#
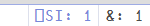
Fig. 6.2 Purple highlighting of ⎕SI upon reaching an error in the RIDE interpreter.#
Furthermore, when using the Windows or RIDE interpreters, an additional trace windows appears, generally at the bottom, as shown respectively by Fig. 6.3 and Fig. 6.4.
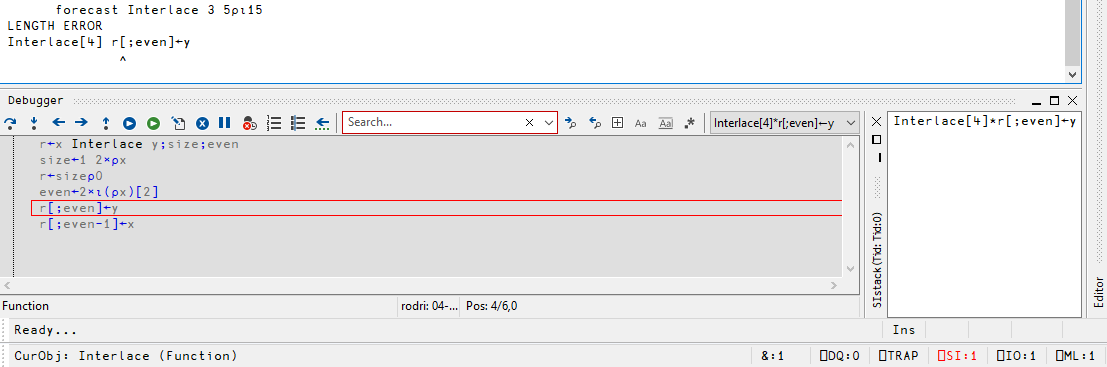
Fig. 6.3 Trace window in the Windows interpreter.#
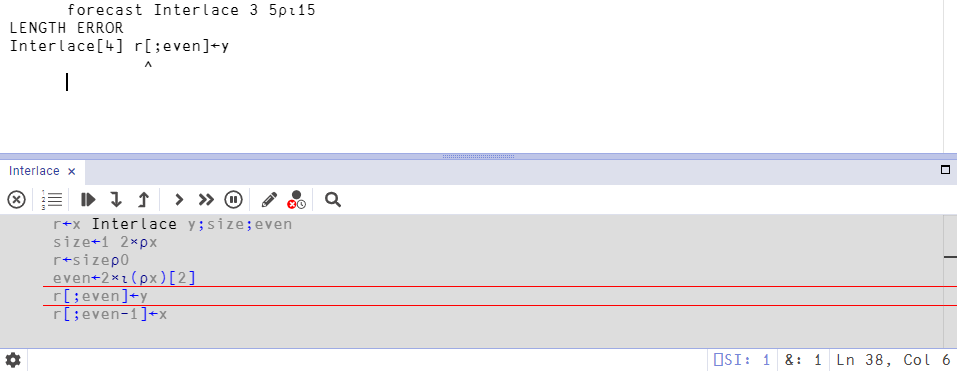
Fig. 6.4 Trace window in the RIDE interpreter.#
APL will preserve the entire execution context (local variables and program status indicators), so that you can resume function execution once the error has been diagnosed and repaired.
Let us now examine the meaning of these things.
6.1.1.2. The Diagnostic Message#
The diagnostic message is displayed on three rows of the screen which show:
the type of error (explained later in Section 6.2.1);
the function name [and line number] - the statement that can’t be executed; and
a caret (the character
∧) which is placed where the statement was interrupted.
A system function named ⎕DM returns the latest diagnostic message.
It is a three-item nested vector, with a sub-vector for each of the three lines, as shown below:
)copy display DISPLAY
DISPLAY ⎕DM
⎕DM retains this value until it is replaced by the occurrence of a new error, or until we explicitly clear it.
6.1.1.3. State Indicator and Line Counter#
Whenever function execution is interrupted for any reason, Dyalog APL keeps track of the exact point where the interrupt occurred in the state indicator (SI for short).
This value of the state indicator may be obtained using a system command )si or a system function ⎕SI:
system command:
)si
#.Interlace[4]*
system function:
⎕SI
┌─────────┐
│Interlace│
└─────────┘
The system function ⎕SI returns a nested vector containing only the names of the interrupted functions;
in this example only one name appears.
The system command )si reports, for each function in the execution stack:
a path (here
#.) which will be explained in a later chapter. Ignore it for now;the function name (
Interlace);the number of the statement on which function execution has stopped (
[4]in this case); andan asterisk which means that this function has been interrupted.
What you see highlighted in the bottom right-hand corner of your session (⎕SI:1) is the number of functions referenced in the state indicator.
Normally, this number should be zero and displayed in black; as soon as an error or an interrupt occurs, it is displayed in a different colour as a warning (in red or purple, depending on your software).
APL also keeps, in a line counter, the list of function lines waiting for execution.
In this case there is only one.
It can be obtained from the system function ⎕LC:
⎕LC
4
The number above shows that Interlace was interrupted on line 4.
Note
Due to limitations of the Jupyter interface, many of the things we will be discussing here will work differently when applied directly to a Dyalog APL notebook.
For example, even though we got an error with the incorrect usage of Interlace and we were able to check the diagnostic message with ⎕DM, the state indicator and the line counter are empty:
forecast Interlace 3 5⍴⍳15
LENGTH ERROR
Interlace[4] r[;even]←y
∧
⎕SI
⎕LC
6.1.1.4. The Trace Window#
If you are running Dyalog APL using the default tracer behaviour, when you reach an error inside a function a window should pop up in the bottom of the interpreter, with the function text displayed in another colour and with the statement in error highlighted.
If you are using the Windows interpreter and the trace window did not appear spontaneously, just press Ctr+Enter. Then, go to “Options” ⇨ “Configuration” ⇨ “Trace/Edit” and tick the checkbox next to “Show trace stack on error”.
We shall see later how this trace window can be used. Do not close it for the moment.
6.1.1.5. You Can See the Local Variables#
Your cursor may not be in this (trace) window: it may remain in the session window, so that you can conveniently enter expressions to diagnose what has happened. If the trace window does have the focus, you can just switch the focus to the session window and work there, without closing the trace window.
Because the function has been interrupted, all its local variables are visible:
you can look at their values; and
you can even modify them (sometimes this may help).
⍴y
3 5
size
4 12
⍴r[;even]
4 6
You can see that the size of the future result is correct, but we cannot assign the 3 rows of y into the 4 rows of r.
6.1.1.6. What Can We Do?#
Obviously, in this case there is nothing we can do: the function is correct, we just misused it! We could, perhaps, forget about it and go on to do something else. However, if we do so, APL will retain the entire execution stack of functions and local variables in its interrupted state. If we are not going to continue debugging, we should really clean up by getting the system out of this state.
There are three ways to achieve this. If you want to try all three of them out, you will need to reproduce the same error after each exit operation:
close the trace window. You can use the standard windows methods to close it, or you can click on it (to give it the focus) and then press Esc to close it;
type a branch arrow
→in the session window (as seen in Section 5.16.4.1); orexecute the
)resetcommand in the session window.
Whichever option you chose, you can verify that:
both
)siand⎕SInow give an empty result andthe highlighted indication
⎕SI:1is replaced by a neutral⎕SI:0in the session status bar.
However, there is a little difference: with the first two methods, ⎕DM retains its value (and keeps track of the latest error), while )reset also clears ⎕DM.
In fact, we can generate an error right here in the session:
1 2 + 3 4 5
LENGTH ERROR: Mismatched left and right argument shapes
1 2+3 4 5
∧
Notice ⎕DM contains the information about this error:
⎕DM
If we use the )reset command, then ⎕DM becomes empty:
)reset
⎕DM
6.1.2. Cascade of Errors#
We shall now see what happens when an error occurs in a sub-function.
6.1.2.1. Preparation#
A palindrome is a string of characters which remains the same when it is reversed, after any non-alphabetic characters (including spaces) have been removed. For example, “Cigar: toss it in a can. It is so tragic.” and “Was it a car or a cat I saw?” are palindromes.
We shall try to write a function which detects whether or not a given string of characters is a palindrome. We are going to use two auxiliary functions:
Upperremoves all non-alphabetic characters and transforms the remaining letters into uppercase characters.
]dinput
Upper ← {
low ← 'abcdefghijklmnopqrstuvwxyz'
up ← 'ABCDEFGHIJKLMNOPQRSTUVWXYZ'
all ← low,up
text ← (⍵∊all)/⍵
(up,up)[all⍳text]
}
Upper 'Visit New York'
Reversereverses the items of a vector.
This is one possible solution to an exercise from the previous chapter, written by someone who was unaware that APL has a reverse primitive (introduced in a later chapter):
]dinput
Reverse ← {
index ← (1+≢⍵)-⍳≢⍵
⍵[index]
}
Reverse 'Demonstration'
Finally, Palindrome compares the uppercase version of the original vector against its reversed version:
]dinput
Palindrome ← {
vector ← Upper ⍵
torvec ← Reverse vector
torvec≡vector
}
Let’s try it out:
Palindrome 'Was it a car or a cat I saw?'
Palindrome 'Am I a palindrome?'
Now, in Palindrome we decide to replace Reverse by ReverBug, a deliberately faulty and obtuse version.
Not only does it use an unnecessary loop, but it includes some (intentional) errors:
∇ rev ← ReverBug vec; from; to ⍝ Intentionally faulty.
rev ← (≢vec)⍴'?'
from ← 0
:Repeat
from ← frm+1
to ← (≢vec)-from
rev[to] ← vec[from]
:Until from=≢vec
∇
6.1.2.2. Let Us Create More Errors#
First, let us execute the little function Plus, shown below, with incorrect arguments, so as to obtain a LENGTH ERROR:
]dinput
Plus ← {
⍺ + ⍵
}
5 1 7 Plus 6 2 9 4
LENGTH ERROR: Mismatched left and right argument shapes
Plus[1] ⍺+⍵
∧
As in the previous example, if you are following along with the examples in the Windows interpreter or in RIDE,
an error message is issued, and a trace window pops up;
⎕SI:1is now highlighted and displayed in the status bar, and)sicontains one line; and⎕LCcontains the value1(the function is interrupted on line 1).
We shall intentionally ignore this error. Do not close the trace window.
As a side comment, notice that if you defined the Plus dfn in a single line, for example with Plus ← {⍺ + ⍵}, then the trace window will not appear. In that case, you would have to redefine Plus to span multiple lines or rewrite it as a tradfn.
And now, let us execute Palindrome (after replacing the usage of Reverse with the faulty ReverBug).
An error is immediately reported:
]dinput
Palindrome ← {
vector ← Upper ⍵
torvec ← ReverBug vector
torvec≡vector
}
Palindrome 'Was it a cat or a car I saw?'
VALUE ERROR: Undefined name: frm
ReverBug[4] from←frm+1
∧
a second error message is issued;
in the bottom right corner of our session, we now have the information
⎕SI:3;⎕LCcontains three values:4 2 1; andwe now have three stacked trace windows instead of one:
one window contains
Plus, unchanged;a second window contains
Palindrome, in a different colour; andon top of that, a third window contains
ReverBug.
Although the three trace windows are stacked, you should only be able to view one at a time and, in this case, the ReverBug trace window should be the one that is visible right now.
First, let us consult the indicators we know.
⎕DM still shows the latest known error, and ⎕SI gives the names of the three interrupted functions, the last one being displayed first:
⎕DM
┌───────────┬──────────────────────┬──────────────────┐
│VALUE ERROR│ReverBug[4] from←frm+1│ ∧│
└───────────┴──────────────────────┴──────────────────┘
⎕SI
┌────────┬──────────┬────┐
│ReverBug│Palindrome│Plus│
└────────┴──────────┴────┘
)si
#.ReverBug[4]*
#.Palindrome[2]
#.Plus[1]*
Notice that
the star next to
#.ReverBug[4]meansReverBugis interrupted;#.Palindrome[2]has no star to its right, it is “pending”; andthere is also a star next to
#.Plus[1]becausePluswas also interrupted.
As you can see, )si is a stack.
Starting from the bottom, it indicates that Plus was interrupted on line [1].
Then Palindrome[2] has called ReverBug, and finally ReverBug caused an error in line [4].
Both ⎕SI and ⎕LC report the most recently interrupted function first, followed by the others.
Palindrome has not itself generated an error: it is just waiting for the completion of ReverBug.
The Palindrome function is said to be pending.
For that reason
there is no star to the right of
Palindromein)si; andthe background of its trace window is a different colour from the others, if you are using the Windows interpreter.
6.1.2.3. Switch to Edit Mode#
In this case, the error is obvious and we can try to correct it, but the text displayed in the trace window cannot be edited directly; we must first turn the trace window into an edit window.
To do this, ensure that your cursor is over an empty space in the session window (it must not be over another name) and then:
just double-click (on nothing); or
press Shift+Enter.
Alternatively, you can switch focus to the trace window and place the cursor before the start of any function line and press Shift+Enter.
All three methods should make the colour of the trace window change, most likely from grey to white, if you are using the default colour scheme.
You can now modify the incorrect statement (change frm into from), and press Esc to fix the modification.
The system switches back to the original colour, showing the newly corrected statement.
6.1.2.4. Continue Execution#
After making the correction, you can choose to either:
resume the function from the interruption point; or
continue by tracing its execution, statement by statement, to see what happens.
Let us choose the first option. This can be achieved using one of the following methods:
in the session window, execute
→⎕LC, which is equivalent to→4 2 1in this case. The branch arrow ignores all but the first number, so the program resumes execution from line number 4 in the function at the top of the stack (ReverBugin this case); orin the trace window toolbar, press the continue execution of this thread button. Fig. 6.5 and Fig. 6.6 show what this button looks like for users of the Windows interpreter and of RIDE, respectively.
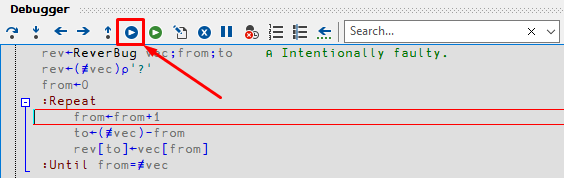
Fig. 6.5 Continue execution of this thread button in the Windows interpreter trace window.#
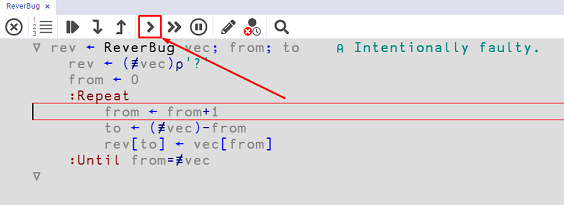
Fig. 6.6 Continue execution of this thread button in the RIDE trace window.#
The function resumes its execution but, unfortunately, a second error immediately appears:
INDEX ERROR
ReverBug[6] rev[to]←vec[from]
∧
The indicators are nearly the same; they now tell us that the function is no longer interrupted on line 4, but on line 6.
To diagnose the problem, we can look at the values of our local variables. We can either double-click on their names (which will open each one in a new window), or just type their names in the session; let us use the latter approach:
rev
ASITACARORACATISAW?
Something is wrong: the first letter (W) should be in the last position where the “?” is.
≢vec
19
This confirms we had an argument with 19 letters.
from
19
And we are trying to move the 19th letter…
to
0
to the last index, but it being equal to zero causes an error.
Our statement in line [5] calculated the wrong index!
It would be insufficient to correct the statement and continue with the current execution, because the variables are already wrong.
A better solution would be to correct line [5], exit from ReverBug and restart where Palindrome called it.
Let us modify the 5th statement of ReverBug to be to ← (1+≢vec)-from.
Now, if we want to return to the calling function, we cannot execute )reset nor →, because that would cause a complete exit both from ReverBug and from Palindrome.
The only way back is to ensure that the ReverBug trace window has the focus and then press Esc to get out of ReverBug and return to Palindrome.
We are now back in the callling environment:
)si
#.Palindrome[2]*
#.Plus[1]*
Notice that ReverBug is no longer present in the state indicator and that the asterisk is now displayed alongside Palindrome, because Palindrome is now the interrupted function.
Then, resume the execution of Palindrome exactly as we restarted ReverBug:
execute
→⎕LCin the session; orpress the continue execution of this thread button in the trace window toolbar.
→⎕LC
1
If we run →⎕LC (or press the continue execution button, for that matter) the result we get back is 1, because the sentence 'Was it a car or a cat I saw?' is a palindrome.
Despite Palindrome having returned its result, we still have an old interrupted function:
)si
#.Plus[1]*
⎕DM
┌───────────┬─────────────────────────────┬────────────────┐
│INDEX ERROR│ReverBug[6] rev[to]←vec[from]│ ∧│
└───────────┴─────────────────────────────┴────────────────┘
As you can see, ⎕DM does not report the stack of errors, just the last one that occurred.
The best thing we can do now to restore a clean environment is to execute:
)reset
6.1.3. Information and Actions#
6.1.3.1. Indicators#
When an error occurs, a number of program status indicators are available for the developer’s use. Not all of them will be described here; we shall just explore the most useful ones.
Code |
Name |
Description |
|---|---|---|
|
State indicator |
List of suspended functions with line numbers and state. |
|
State indicator |
Nested vector of suspended or pending functions names. |
|
Diagnostic message |
3-item nested vector which reports the message associated with the latest error. |
|
Line counter |
Numeric vector containing the line numbers of functions that are pending or suspended and waiting for execution, the last one being displayed first – the same order as |
|
Event number |
Every type of error or exception is identified by a number. The number of the latest error is reported by |
Here are some very common event numbers; they will be explained in the next section:
|
Message |
|---|---|
1 |
|
2 |
|
3 |
|
4 |
|
5 |
|
6 |
|
11 |
|
A full list of event numbers is given in Section 14.6.
6.1.3.2. Some Possible Actions#
→⎕LCcontinues the interrupted function from the very statement on which it was interrupted (same as pressing the continue execution of this thread button);→0quits the interrupted function and returns to its calling environment, which may be the session, or a calling function (same as putting focus on the trace window of the interrupted function and pressing Esc). In the latter case, execution will be resumed in the calling function;→quits the interrupted function and all its calling functions, and returns to the session. If other functions are suspended, they remain in the state indicator; and)resetquits all suspended functions, resetting the state indicator.⎕SI,⎕DM, and⎕LCare reset to empty vectors and⎕ENis set to zero.
6.1.4. Why Should You Reset Your State Indicator?#
Let us pretend for a second that you were working in the session, trying to figure out how to solve the exercises from Section 5.4. In particular, you were trying to solve the exercise where you have to implement a function that produces a series of integers starting on one argument and going up to the other one.
First things first, you create the variables that tell you where the sequence should start and end:
from ← 17
to ← 29
Then you start trying to figure out how many numbers you should generate, and how to actually generate them:
to-from
⍳to-from
from+⍳to-from
¯1+from+⍳to-from
Eventually you reach this expression and feel good about it, so you decide to save it as a short dfn:
To ← {¯1+⍺+⍳⍵-⍺}
17 To 29
The exercise is solved and you proceed to programming something else, so you decide to implement a Reverse function, but alas you make a flawed implementation, like the one in ReverBug:
∇ rev ← ReverBug vec; from; to ⍝ Still intentionally faulty.
rev ← (≢vec)⍴'?'
from ← 0
:Repeat
from ← from+1
to ← (≢vec)-from
rev[to] ← vec[from]
:Until from=≢vec
∇
When you call it, you realise you made a mistake, because the function throws an error:
ReverBug 17 To 29
INDEX ERROR
ReverBug[6] rev[to]←vec[from]
∧
You look around for a bit and find your mistake, as the fifth statement should have read to ← (1+≢vec)-from instead of the current to ← (≢vec)-from.
You correct your mistake and fix the function, but then don’t reset the stack because you see no point in it.
Just a little while latter, you reuse your To function and notice that it looks weird:
17 To 29
The sequence of numbers produced should go up to, and including, 29, and it currently stops at 28.
So, you decide to go back and play a bit more with the expression you had before defining the To function:
¯1+from+⍳to-from
DOMAIN ERROR
¯1+from+⍳to-from
∧
to from
0 12
The variables to and from you were playing with are not visible in your session because they are being shadowed (“hidden” or “covered”) by the local variables inside ReverBug.
As soon as we reset the state indicator, the local variables of ReverBug disappear, and your little expression can be used again:
)reset
¯1+from+⍳to-from
17 18 19 20 21 22 23 24 25 26 27 28
You then proceed to understanding that you are generating one too few numbers, and manage to come up with the correct expression for your To function:
¯1+from+⍳1+to-from
To ← {¯1+⍺+⍳1+⍵-⍺}
So, having a “dirty” state indicator can easily lead to a lot of confusion.
You should also be aware that because APL preserves the full context in which a function stopped or crashed, all the local variables are retained too; this may require a lot of memory space!
Tip
When a function crashes, always try to clear the stack if you can:
try to correct the problem and resume function execution; or
if that is impossible, abort it and reset the execution context by executing
)reset.
If you can’t fix it right now, Dyalog will allow you to )save the workspace and come back to it later.
6.2. Most Frequent Error Messages#
6.2.1. Execution Errors#
For each common error, we shall give you the most probable reason for the error, some rare cases which may be difficult to debug, and suggest some immediate experiments that you can carry out to help diagnose the problem.
Among the six most common errors, four are really easy to diagnose, but the last two are a bit more complex.
6.2.1.1. VALUE ERROR (⎕EN = 6)#
You used a name which does not have a value; it does not represent a variable, a function, or an operator.
Here are some possible reasons:
perhaps you misspelled the variable (or function) name, entered the incorrect mixture of upper and lower case characters, or confused the letter “O” with the digit “0”, etc;
you tried to use the result of a function which actually produces no result (see Section 5.10.2);
you tried to reference one of the local variables of a function before it was assigned a value – remember that all variables referenced in the header of a tradfn are local, and so are all the variables defined inside dfns; and
an erroneous tradfn header, as explained below.
Imagine you intended to create a function named Travel, with two arguments named west and east.
When you entered the header, you forgot the space between Travel and east, so that the function now looks like this:
∇ z ← west Traveleast
z ← west-east
∇
Instead, you just defined a monadic function named west, with a right argument named Traveleast.
When you try to use Travel, it does not exist, and you get an error:
0 Travel 1
VALUE ERROR: Undefined name: Travel
0 Travel 1
∧
If you suspect that this has occurred, and you can remember the syntax of the function, check to see if you have a different function whose name is the same as your intended left argument.
For example, below we can find a function named “west” instead of “Travel”:
)fns
If you do not spot it immediately, and if you are using the Windows interpreter, you can use the search tool (generally available in the toolbar as the magnifying lens or under “Tools” ⇨ “Search…”). Once the window opens, you can type the name that you want to search for and then click “Find Now”. You should then discover what the name of the misspelled function really is, as shown in Fig. 6.7.
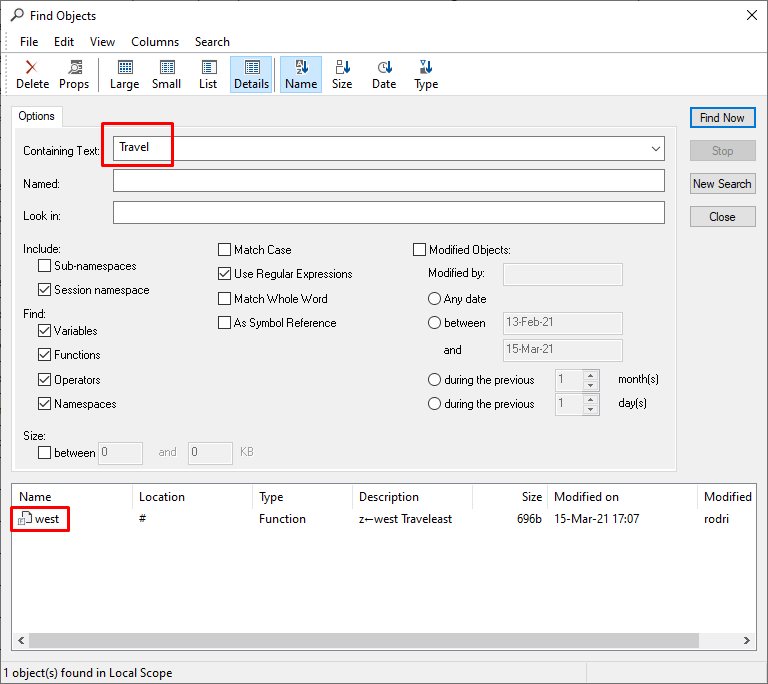
Fig. 6.7 The “Search” window of the Windows interpreter.#
6.2.1.2. LENGTH ERROR (⎕EN = 5)#
A LENGTH ERROR usually involves two arguments with inconsistent shapes for a given operation.
For example:
4 6 8 + 3 7
LENGTH ERROR: Mismatched left and right argument shapes
4 6 8+3 7
∧
Tip
If an operation like X+Y causes a LENGTH ERROR, look at the shapes of both arguments X and Y, and see if they are compatible with one another.
Also remember that:
a matrix with only one row looks like (but is not) a vector and a matrix/vector with only one element looks like (but is not) a scalar (see Section 3.3.4); and
an incorrectly specified axis may also cause such an error.
To exemplify a LENGTH ERROR with an incorrect axis specification, let us define
⎕← MatA ← 3 4⍴⍳12
⎕← MatB ← 5 4⍴⍳20
Both MatA,MatB and MatA,[2]MatB cause a LENGTH ERROR but both MatA⍪MatB and MatA,[1]MatB will work:
MatA,MatB
LENGTH ERROR
MatA,MatB
∧
MatA,[2]MatB
LENGTH ERROR
MatA,[2]MatB
∧
MatA⍪MatB
MatA,[1]MatB
6.2.1.3. RANK ERROR (⎕EN=4)#
A RANK ERROR means that you tried to do something which is not consistent with the rank of an array.
This may involve one or more variables.
Let us recall our forecast matrix and use it to show some common examples of this type of error:
⎕RL ← 73
⎕←forecast ← 10×?4 6⍴55
forecast[3 5]
INDEX ERROR
forecast[3 5]
∧
The indexing above is incorrect because forecast is a matrix, not a vector.
A semicolon is needed somewhere: [;3 5], [3;5], or [3 5;].
forecast + ⍳6
RANK ERROR: Mismatched left and right argument ranks
forecast+⍳6
∧
The above cannot work, even if forecast had only one row and looked very much like a vector.
A RANK ERROR is also issued when an axis is not correct.
For example:
MatA,[3]MatB
RANK ERROR: Invalid axis
MatA,[3]MatB
∧
This cannot work because MatA does not have 3 dimensions.
Similarly,
1 2 3 4,[2]5
RANK ERROR: Invalid axis
1 2 3 4,[2]5
∧
cannot work because a vector only has one dimension.
Sometimes incorrect syntax can also lead to a RANK ERROR.
For example, to concatenate the two matrices shown above, the correct syntax is MatA,[1]MatB, but you could have typed that as
MatA[1],MatB
RANK ERROR
MatA[1],MatB
∧
Notice the misplaced comma, which leads APL to try and calculate MatA[1], which fails because MatA is a matrix and not a vector.
Tip
If a statement causes a RANK ERROR, look at the shapes of all the arrays involved in the expression.
6.2.1.4. INDEX ERROR (⎕EN=3)#
You tried to index a variable, but your index was wrong. For example, you tried to get the 20th element of a vector which only has 17 elements.
This occurs when the index (or one of the items of the index) is:
smaller than or equal to zero;
greater than the length of the variable, along the specified axis; or
not an integer.
forecast[5;5]
         INDEX


         ERROR
forecast[5;5]
∧
This doesn’t work because forecast has 6 columns but only 4 rows: the second index is good but the first one is not.
Tip
If the error occurs in an indexing operation like var[indexA;indexB;...], look at the shape of var and check if indexA, indexB, etc., contain values which are compatible with the size of var.
6.2.1.5. DOMAIN ERROR (⎕EN=11)#
This error is much more complex to diagnose.
It usually means that some function cannot be applied to a particular value or type of data; the data is oustide the domain in which the function is designed to operate.
Here are some very common circumstances in which a DOMAIN ERROR occurs:
dividing by a zero;
3 ÷ 0
DOMAIN ERROR: Divide by zero
3÷0
∧
1 2 3 4 ÷ 0 1 2 3
DOMAIN ERROR: Divide by zero
1 2 3 4÷0 1 2 3
∧
arithmetic operations with non-numeric arguments;
45 + '12'
DOMAIN ERROR
45+'12'
∧
Beware: this may be difficult to see when a variable contains numeric characters such as '0123456789'.
Hint: for a simple array a, the expression 0=1↑0⍴a returns 1 if the array is numeric and 0 if it is a character array:
0=1↑0⍴123 2345 1 42
0=1↑'12342'
trying to index with characters or non-integer values;
a ← 1 2 3 4
a['2']
DOMAIN ERROR
a['2']
∧
a[2.5]
DOMAIN ERROR
a[2.5]
∧
using numbers other than
0or1with Boolean operations, like⍲;
3 ⍲ 1
DOMAIN ERROR
3⍲1
∧
and
some computations may result in numbers that are larger than the largest number that the computer can represent.
*/⍳1000
DOMAIN ERROR
*/⍳1000
∧
More generally, all these statements are in themselves perfectly correct when applied to appropriate data. However, they may fail when applied to other, inappropriate data.
Tip
Do not worry too much about the syntax of your statement: it is probably good. You should instead try to determine which values are appropriate to the operation, and check whether the actual values are within the operation’s domain.
6.2.1.6. SYNTAX ERROR (⎕EN=2)#
This error may also be a difficult one. It means that a statement is ill-formed! Do not worry about your data: the problem arises from the statement itself.
Typically, the reason is that you have entered the wrong number of parentheses, quotes, or brackets: check that your parentheses, quotes, and brackets are well balanced.
Here are some incorrect expressions:
(3+5)*2)
SYNTAX ERROR: Unpaired parenthesis
(3+5)*2)
∧
'ISN'T IT?'
SYNTAX ERROR: Unpaired quote
'ISN'T IT?'
∧
a[a[3]
SYNTAX ERROR: Unpaired bracket
a[a[3]
∧
Some other typical sources of SYNTAX ERROR include
monadic use of a dyadic primitive or user-defined tradfn;
<45 67
SYNTAX ERROR: The function requires a left argument
<45 67
∧
Interlace 3 3⍴⍳9
SYNTAX ERROR: The function requires a left argument
Interlace 3 3⍴⍳9
∧
use of the upper minus sign with a name;
var ← 5
3+¯var
SYNTAX ERROR
3+¯ var
∧
(you should write ¯5 or -var)
a missing
:Endin a control structure, or other inappropriate use of control structures.
∇ BadTradfn val
:If val > 5
⎕← 'here'
∇
BadTradfn 4
SYNTAX ERROR
BadTradfn[1] :If val>5
∧
6.2.1.7. WS FULL (⎕EN=1)#
You have probably tried to create an array that would be larger than the amount of available memory in the workspace.
if it happens with reshape (
shape⍴contents), check whether the left argument is much bigger than you anticipated;
_ ← 100000000⍴3.4 1 0J1.2
         WS


         FULL
_←100000000⍴3.4 1 0J1.2
∧
similarly, if it happens with compress/replicate (
numbers/variable), check that the left argument does not contain large numeric values (101101/variableis not the same as1 0 1 1 0 1/variable).
A WS FULL may also happen when a recursive function working on a large amount of data calls itself a large number of items.
If this happens, consider whether a plain loop might be a safer solution.
6.2.2. Some Other Errors#
6.2.2.1. Can’t Fix#
This is not an execution error. It happens only when you try to define a function and APL cannot fix it because its header is incorrect. Here are some things you should check:
in a tradfn header, check that all your local variables are separated by semi-colons and not by some other characters (dot, comma, blank, …) and check that there is no extra semi-colon to the right;
F rarg; loca, locb; loccis invalid because there is a comma instead of a semi-colon; andF rarg; loca; locb; locc;is invalid because there is an extra semi-colon.
in a tradfn header, check that you haven’t tried to specify a nested left argument. This is only allowed for the right argument:
left F (one two three)is valid; but(one two three) F rightis invalid.
for dfns and tradfns, check the name of your function. If the name you chose is already in use as a variable, you cannot define a function with that name; and
for a dfn, check that the opening and closing curly braces match.
6.2.2.2. Not Saved, This Ws Is…#
You started with a clear workspace and spent hours developing a set of functions. At the end of the day you decide to save it:
)save D:\Washington\APL\WS\Bidou
Not saved, this ws is CLEAR WS
Don’t panic! This does not mean that your workspace is empty and that you have lost all your work; it is just a friendly warning.
It so happens that in this case a saved workspace named Bidou already exists and Dyalog APL refuses to overwrite it with the active workspace.
Had you been working on a workspace that had the name Tartempion (instead of having started with a clear workspace), the warning message would have been Not saved, this ws is Tartempion.
But because you started with a CLEAR WS and you have not explicitly renamed the workspace, APL will not allow you to save it until you give it a name.
Hence the alarming message that says Not saved, this ws is CLEAR WS.
For this reason, if you are using the Windows IDE, always prefer the graphical interface for saving workspaces, using a file search dialog box.
6.3. Trace Tools#
6.3.1. Invoke and Use the Tracer#
6.3.1.1. Invoke the Tracer#
If you want the tracer to be opened automatically when an error occurs, then you need to make sure to configure that behaviour:
in the Windows IDE, go to “Options” ⇨ “Configure…” ⇨ “Trace/Edit” and make sure to select the option that reads “Show trace stack on error”; or
in RIDE, add the line
Trace_On_Error=1to the “Arguments” box in your connect/start screen. (You can read more about this configuration parameter and all others in Dyalog’s Documentation Centre.) If you do not configure your IDE this way, you must invoke the tracer manually when needed.
When an error occurs, check that your cursor is on an empty line (it should be), and just press Ctr+Enter or activate “Action” ⇨ “Trace” in the toolbar. This is called a naked trace.
But sometimes it is better to anticipate that there will be errors, and trace the execution from the beginning. You can type any valid statement and instead of pressing Enter to execute it, press Ctrl+Enter (the easy way) or activate “Action” ⇨ “Trace” in the session toolbar to trace it. All the functions referenced by this statement will be traced.
Using this technique, you can trace the execution of a function from the very beginning.
6.3.1.2. Trace Actions#
All of the things that you can do may be actioned using the keyboard or the little toolbar which appears on top of the trace window. In the table below, you will find the icons displayed on these buttons (in the Windows IDE and in RIDE), what they do, and the equivalent keyboard shortcuts (if any). Preferably use the keyboard when you can: you will save time.
Win icon* |
IDE icon* |
Usage |
Keyboard shortcut |
|---|---|---|---|
|
|
Execute expression |
Enter |
|
|
Trace expression |
Ctrl+Enter |
|
⁽**⁾ |
Go back one line |
Ctrl+Shift+Backspace |
|
⁽**⁾ |
Skip current line |
Ctrl+Shift+Enter |
|
|
Stop on next line of calling function |
|
|
|
Continue execution of this thread |
|
|
|
Continue execution of all threads |
|
|
|
Edit name |
Shift+Enter |
|
|
Quit this function |
Esc |
|
|
Interrupt |
Ctrl+Pause |
|
|
Clear trace/stop/monitor for this object |
|
|
|
Toggle line numbers |
|
|
Open Search area |
||
|
|
Search for next match |
|
|
|
Search for previous match |
|
|
Search hidden text |
||
|
|
Match case |
|
|
|
Match whole word |
|
|
|
Use regular expressions |
|
|
Find in selection |


⁽*⁾ a blank means the feature is not available in that IDE; current icons might differ from the ones shown in the table.
⁽**⁾ feature available on RIDE through the keyboard shortcut only.
6.3.1.3. Trace Strategies#
Usually, the tracer is employed to execute a function step by step, by repeatedly pressing the Enter key. At each step, you can check the values of your variables. You might perhaps monitor the values of certain significant variables, each in its own window, and see how they change when the function is executed, step after step, or in continuous mode.
When the current statement includes a call to one or more user-defined sub functions, you must decide how it should be processed:
if you are confident in those sub functions and have no doubt about them, just press the Enter key, and the current line will be executed; or
if you think that a sub function requires investigation, press Ctrl+Enter or click on the “Trace expression” button. This will open the tracer on each of the sub functions in turn. You can continue tracing to any depth of function call.
We exemplify this below. Fig. 6.8 shows the tracer window that pops up
as we execute the line Palindrome 'Just to show a function call' with
Ctrl+Enter.
Notice that, to the right of the body of the Palindrome function, we have the stack indicator information.
There is also a light rectangle surrounding the very first line of the Palindrome function, highlighting the expression that is going to be run next.
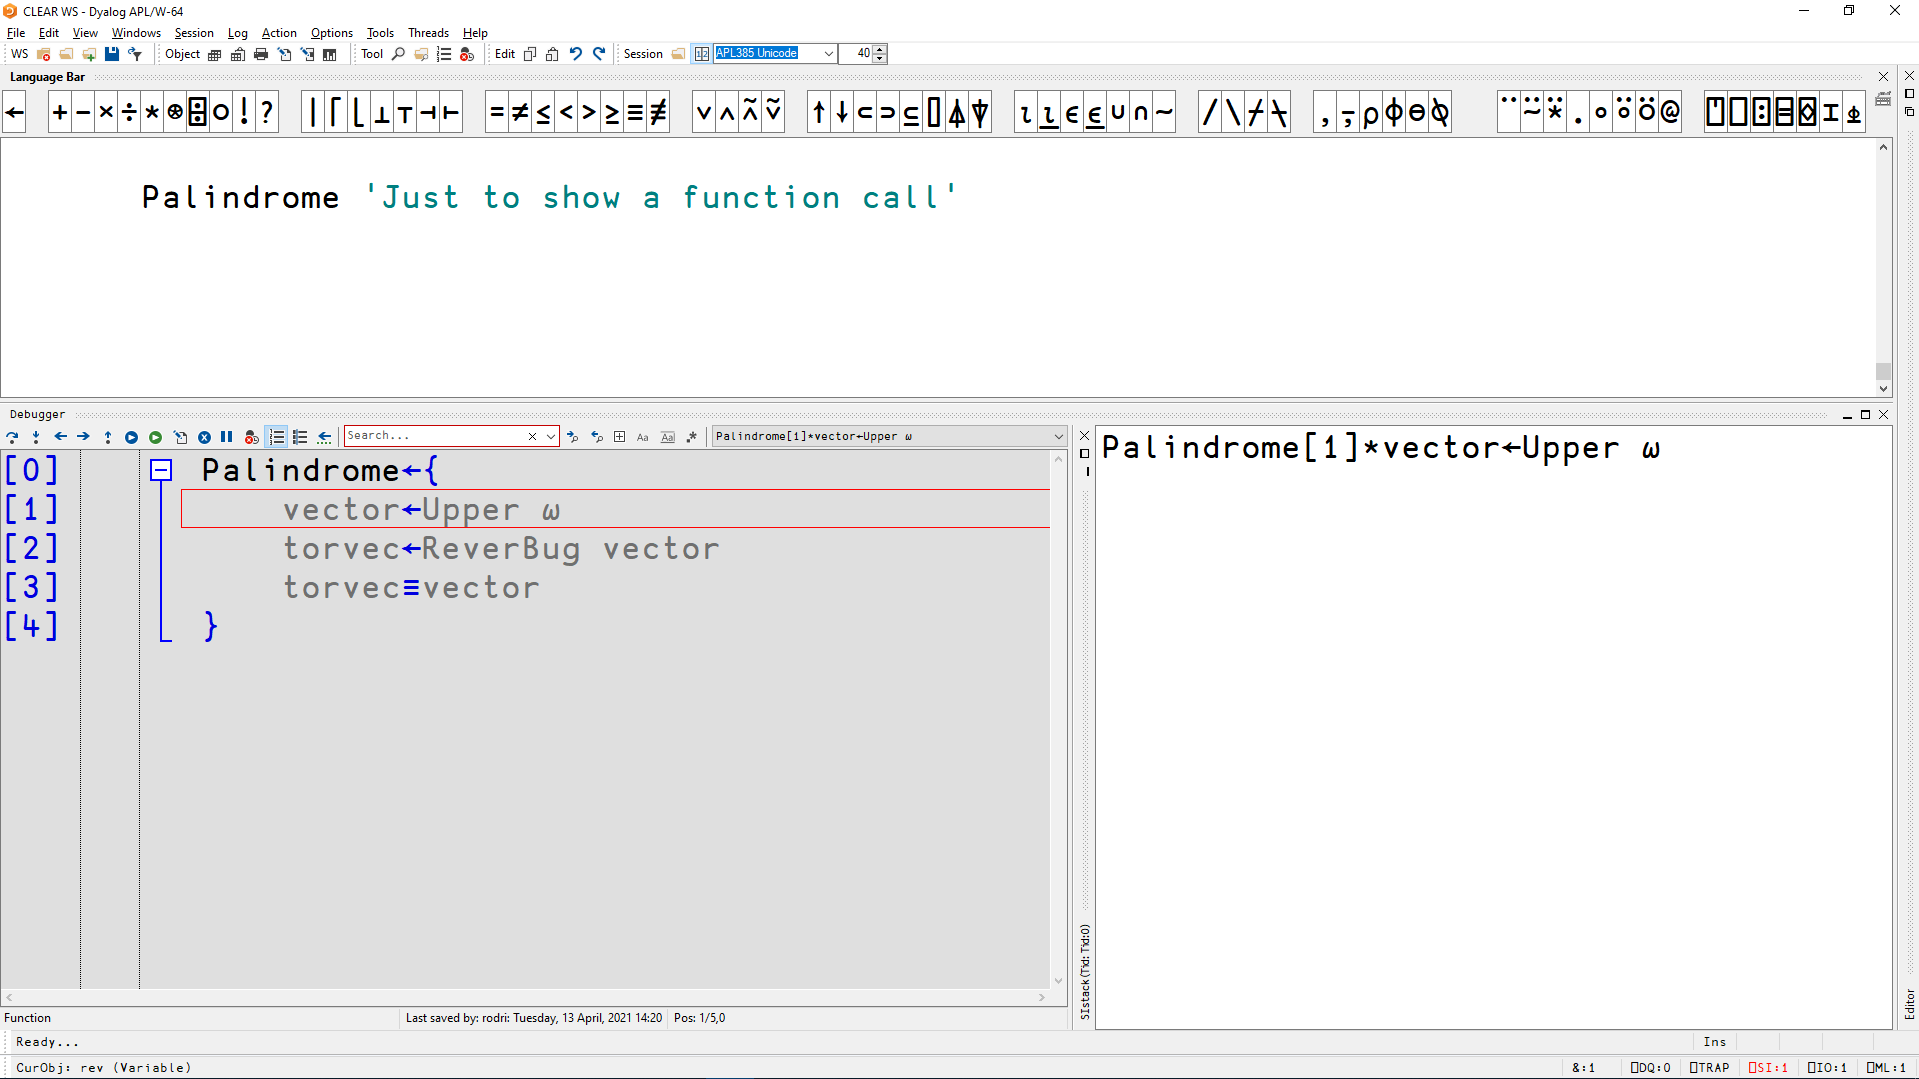
Fig. 6.8 The tracer window in its initial state.#
We are confident that the Upper function works as intended, so we can just execute that expression with Enter (or by pressing the “Execute expression” button).
This executes the expression normally and then leaves the tracer at the second line of the Palindrome function, like Fig. 6.9 shows:
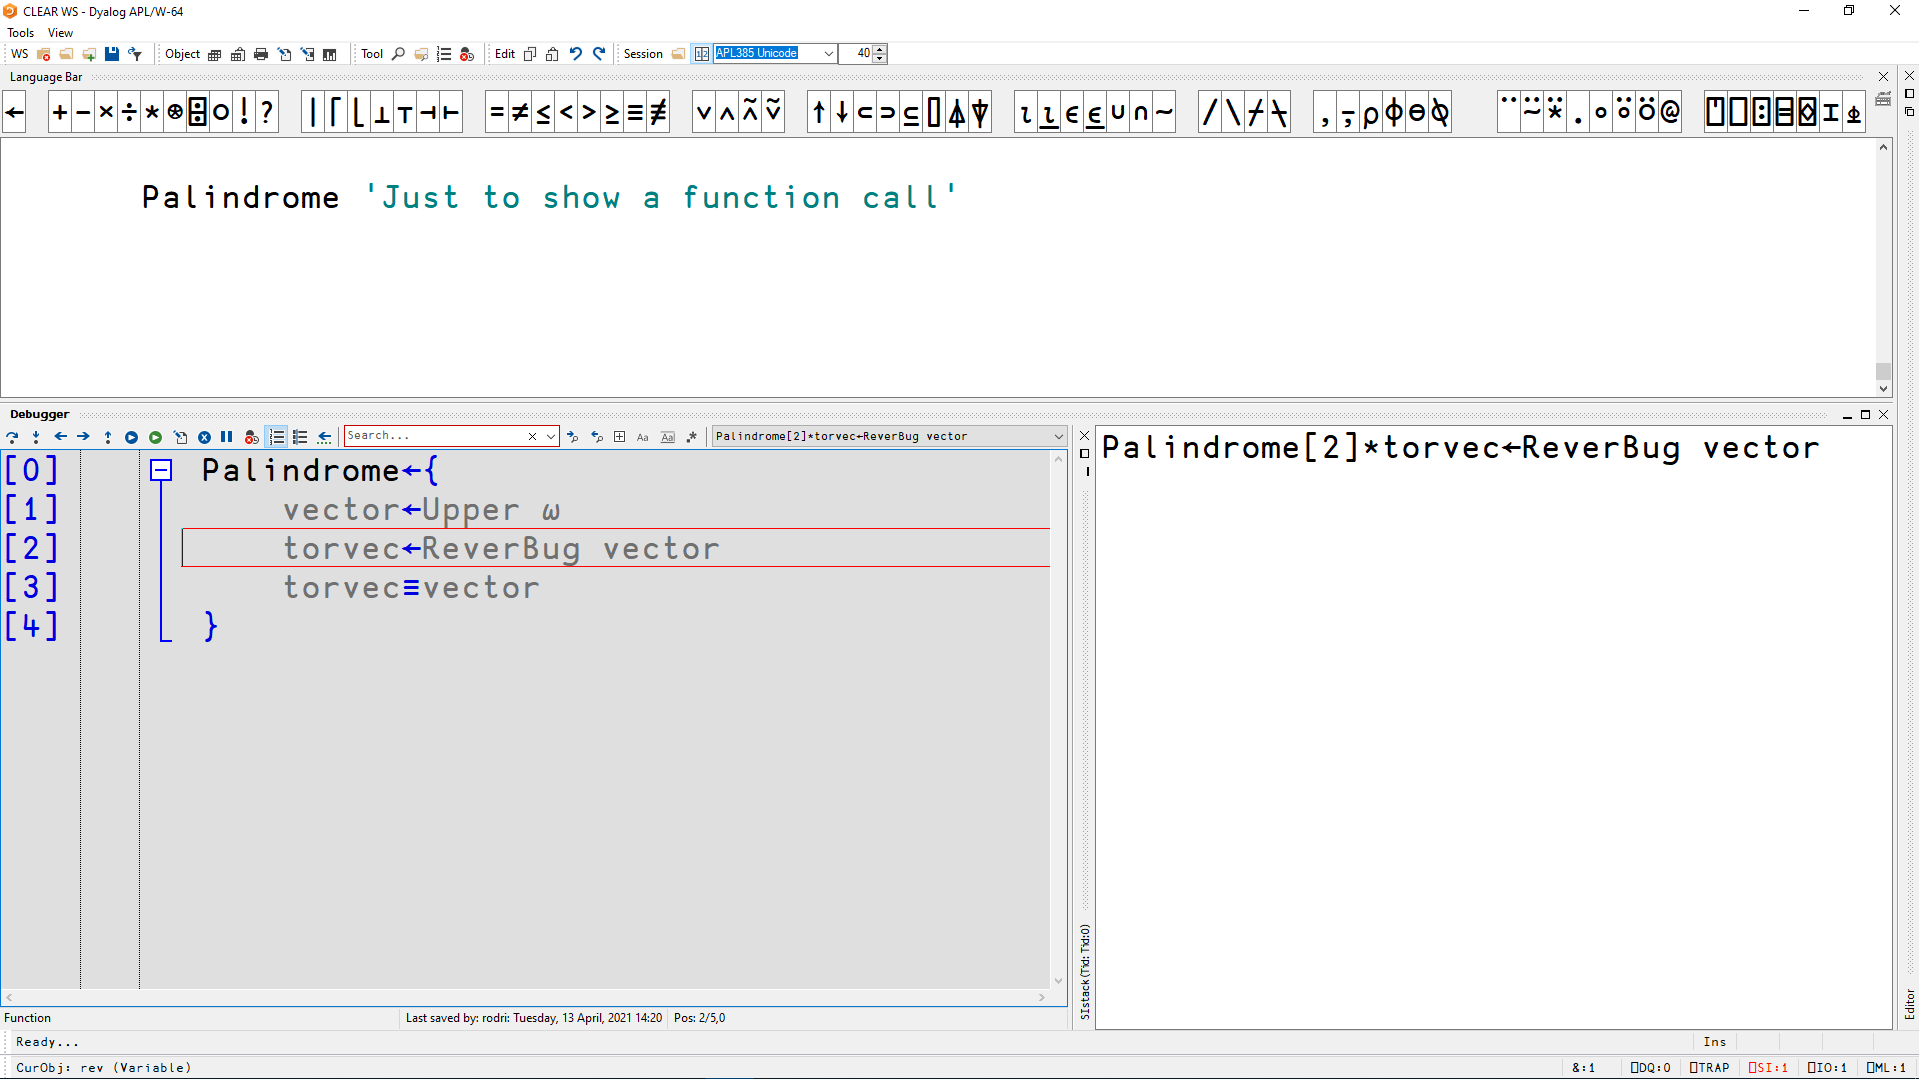
Fig. 6.9 The tracer window stopped at the second line of the Palindrome function.#
The next statement to be executed is the expression that calls the ReverBug function, which we are suspicious of.
Because we want to trace into this function, we press Ctrl+Enter and the tracer window now shows the definition of the ReverBug function.
On the right, the state indicator was now updated to include ReverBug at the top of the stack.
We can see this in Fig. 6.10.
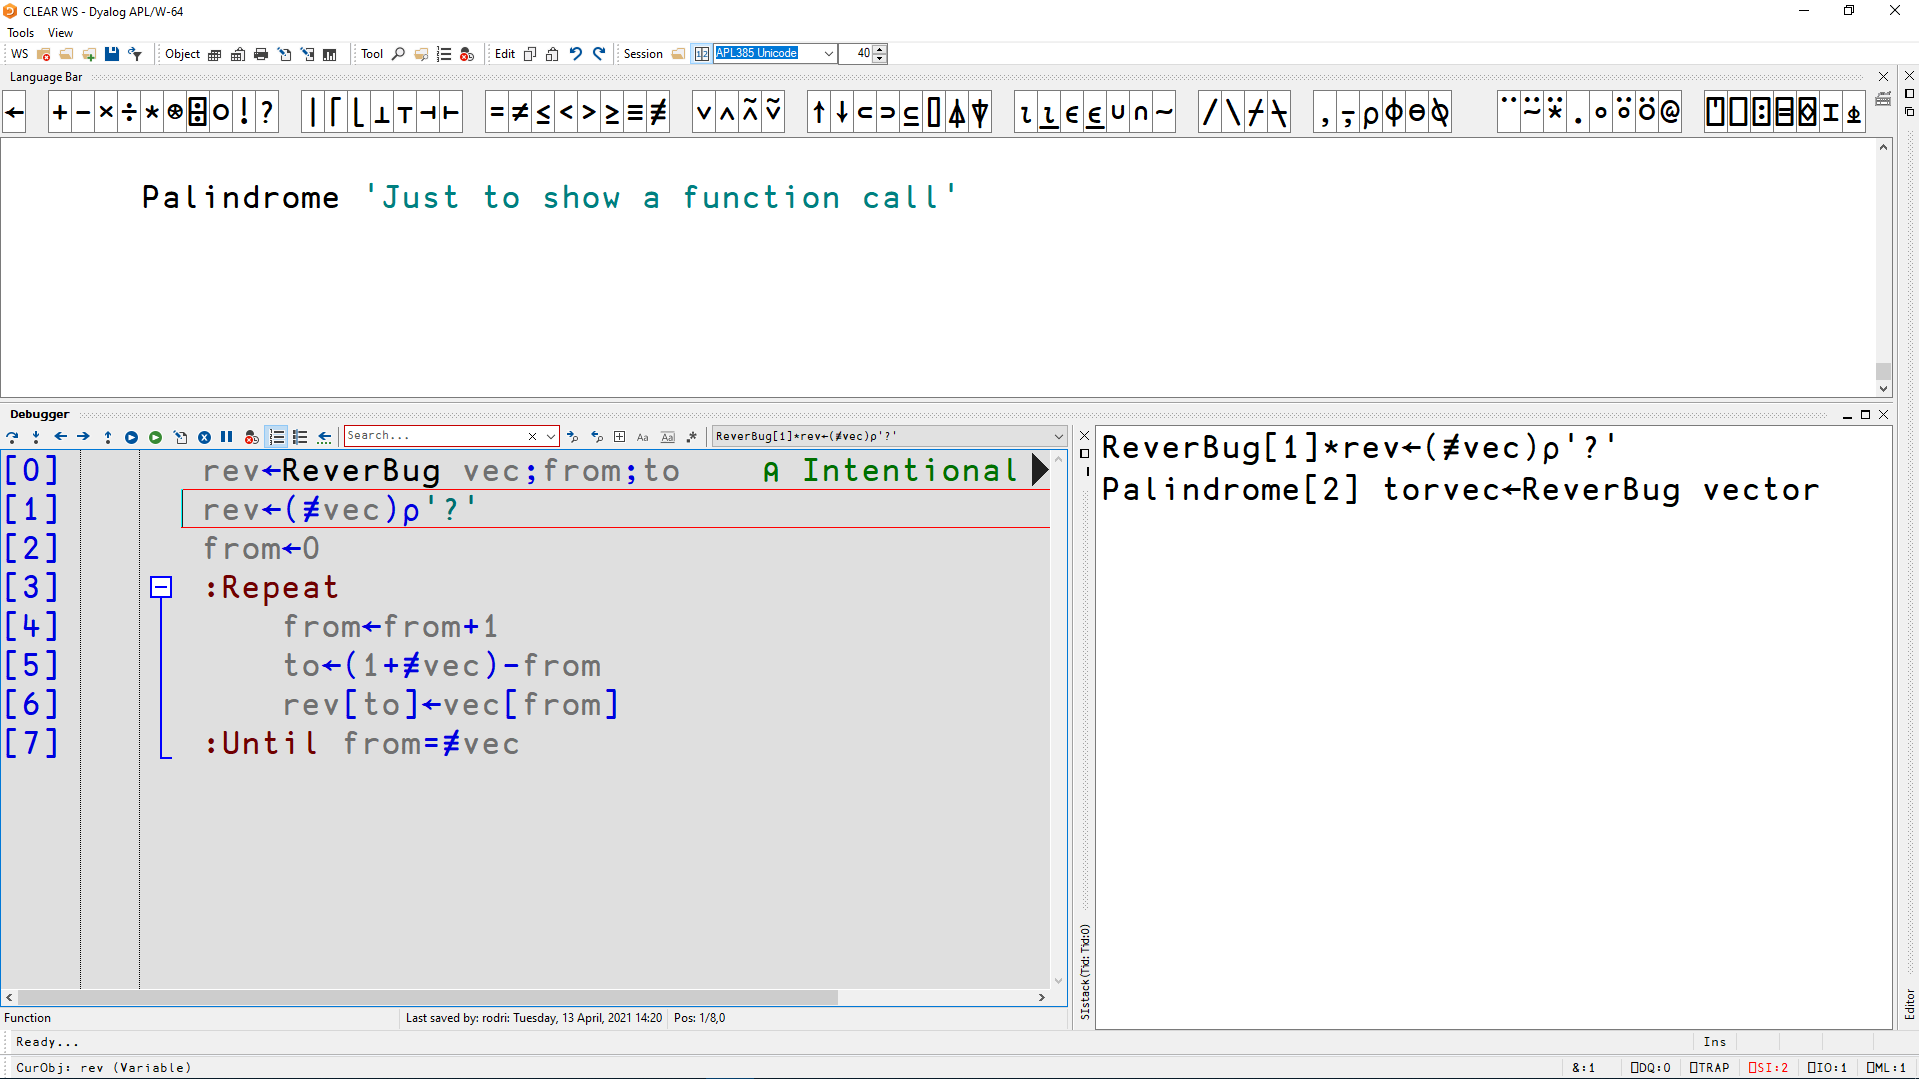
Fig. 6.10 We trace into the ReverBug function.#
If you are using the Windows IDE, you can use the dropdown on the tracer toolbar to take a look at any other function in the stack.
In Fig. 6.11 we reopen the
Palindrome function and we see its background is in a different shade of grey, because Palindrome is now suspended, waiting for the ReverBug function to finish.
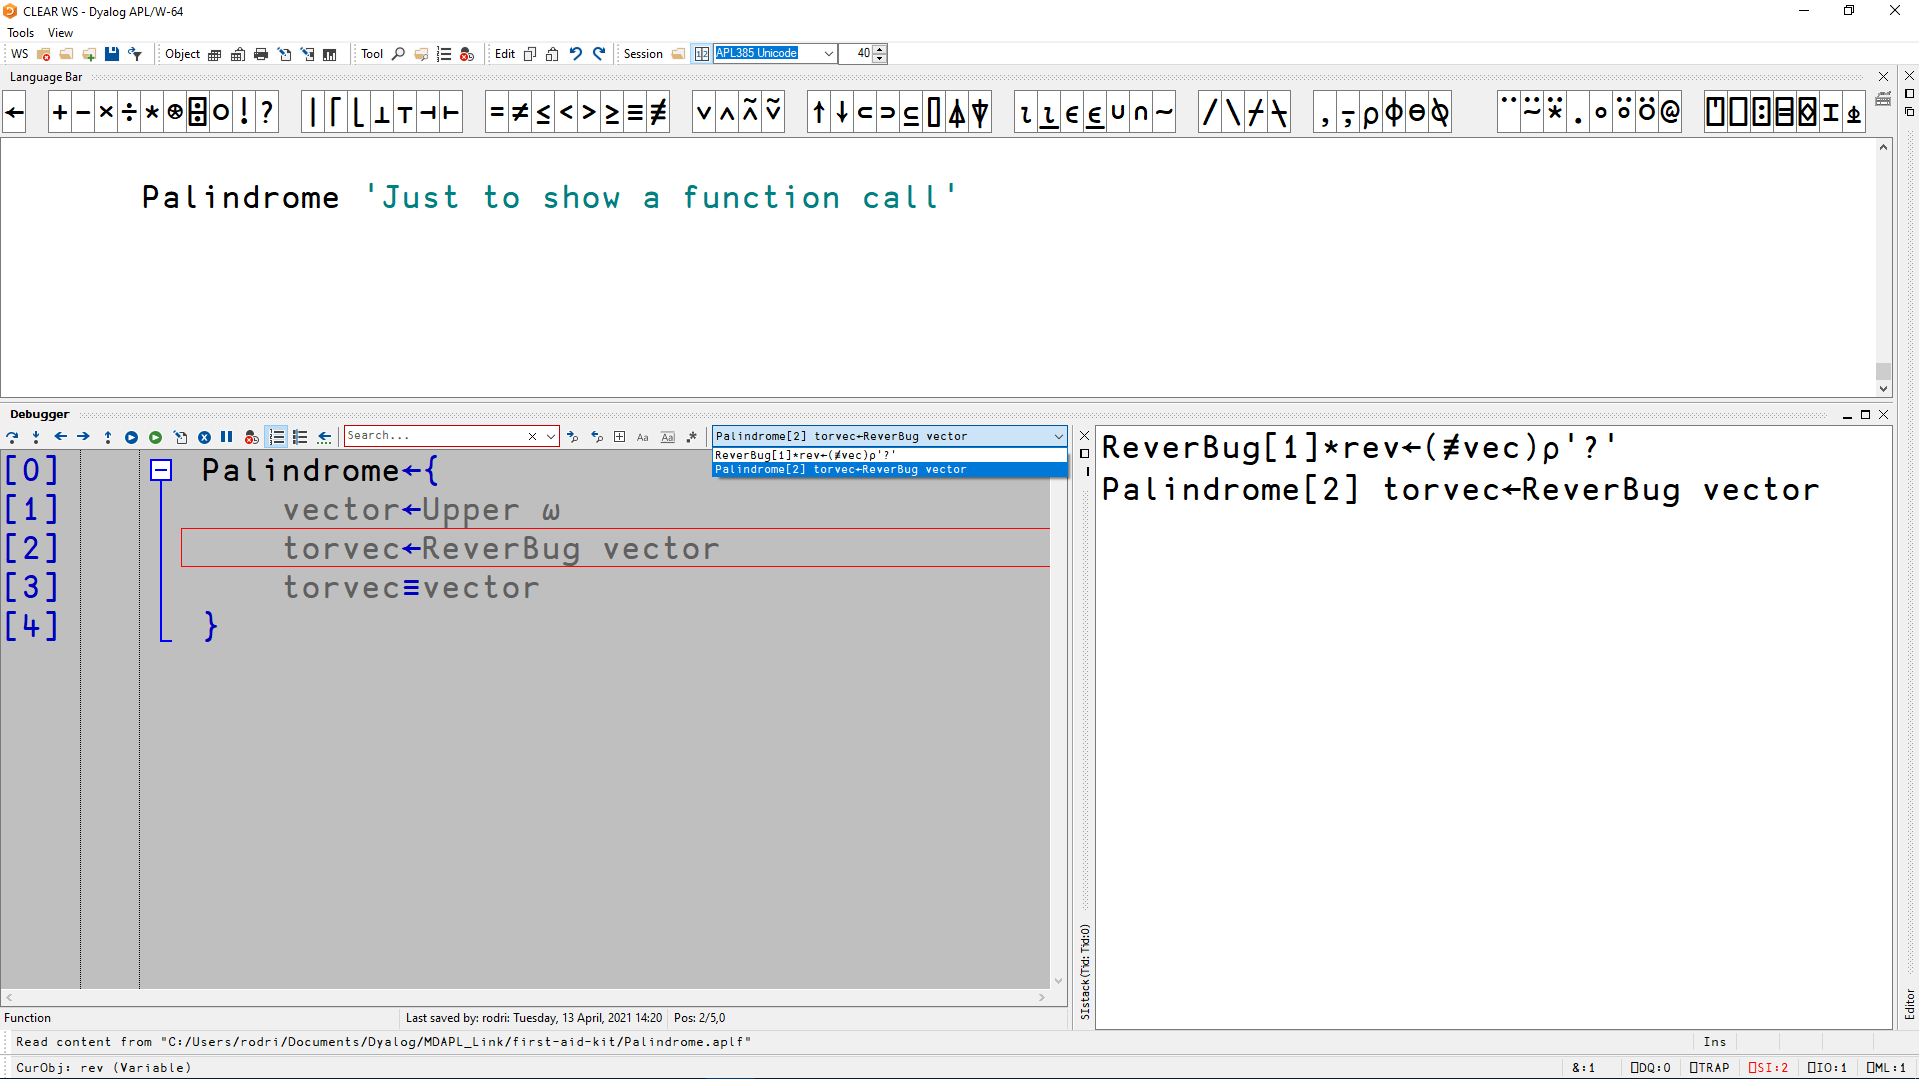
Fig. 6.11 Looking at the Palindrome function while it is suspended.#
We are interested in debugging the ReverBug function, so we return our tracer to the ReverBug function.
Now we want to see how the value of rev evolves during the loop, so, we can initialise rev (that is, run the first expression that assigns something to rev) and then double-click its name to open the editor window on it.
Now we can see rev being updated as we trace through the loop, if we run the expressions one by one.
After a couple of iterations, our session could look like this:
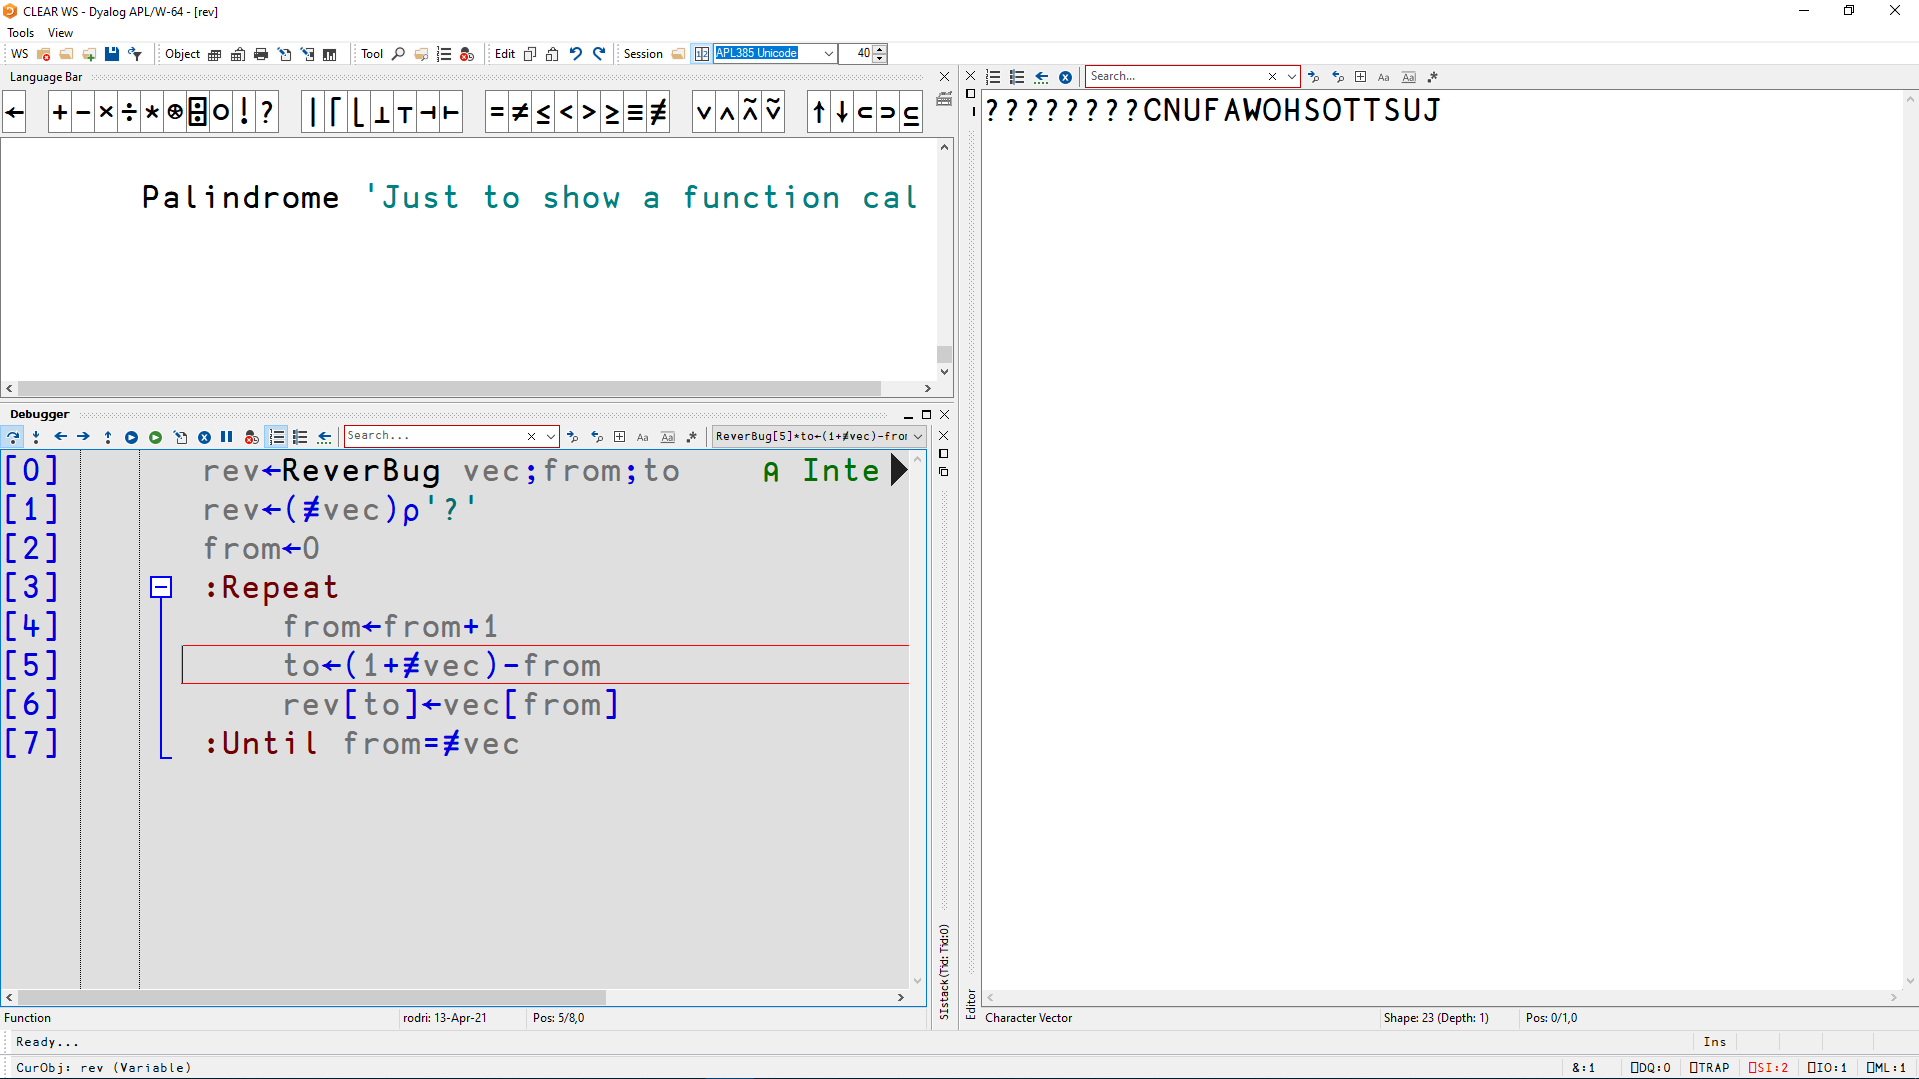
Fig. 6.12 The editor shows the value of rev mid-execution of the ReverBug function.#
Notice that in Fig. 6.12
the window on the right is the editor window showing the value that rev has at that point of the execution of ReverBug.
If we trace through the remainder of the function, the editor window will close automatically when we leave ReverBug because rev, as a variable inside ReverBug, no longer exists.
When in the tracer you can also move the red line to skip some statements:
backward if you want to re-execute some statements after you have changed some parameters or variables, or changed the code, etc. Press Ctrl+Shift+Backspace (or use the “Go back one line” button in the Windows IDE); or
forward, to skip some insignificant statements. Press Ctrl+Shift+Enter (or use the “Skip current line” button in the Windows IDE).
Sometimes an error appears only after an unpredictable number of iterations, and tracing the execution statement after statement would take much too long. In a situation like this, you can display some important variables as shown above, and run the function in automatic mode (press the “stop on next line of calling function” button). You can then stop execution with the “interrupt” button when a given variable is about to take what you suspect might be a critical value.
When you have finished your investigations you can:
resume execution automatically by pressing the “continue execution of this/all threads” buttons, or by executing
→⎕LC; orabort execution by pressing the “quit” button, or by typing
→0, or→, or)reset, depending on your intentions.
6.3.2. Choose your Configuration#
If your program is interrupted in a very deep stack of functions you might prefer if the editor does not open one trace window for every suspended function you have, as those windows may end up occupying most of the screen. You might also prefer to have your trace windows be floating independently of the session, or docked perhaps to the bottom or the side of the interpreter.
By default, the trace window is docked to the session. If you want to change this
on the Windows IDE, go to “Options” ⇨ “Configure” ⇨ “Trace/Edit” and select the option “Classic Dyalog mode”.
on RIDE, go to “Edit” ⇨ “Preferences” ⇨ “Windows” and select the option “Floating windows”.
With regards to having multiple trace windows open, one per sub-function that is suspended, that is never a problem on RIDE because RIDE has a single trace window for all the suspended and interrupted functions. On the Windows IDE, you just have to enable or disable the “Single trace window” option that is under “Classic Dyalog mode”.
When the IDE is set to only have a single trace window, the contents of the trace window are replaced by the new current function, both when the execution enters a sub function and when it returns to its calling function.
It is up to you to decide which configuration is most convenient for you. In any case, this can be changed dynamically, without restarting APL.
Note
Notice that some of these settings might also affect how edit windows are displayed, so be sure to have that in mind when picking your preferred configuration.
6.3.3. Breakpoints and Trace-Controls#
6.3.3.1. Set Breakpoints#
When one wants to investigate the behaviour of a set of statements nested in a very deep sub-function, the best option is to run the main function but tell the system to interrupt the execution just before a particular statement is executed. To achieve this, one can place breakpoints (sometimes named stops) on one or more statements.
When you edit or trace a function, you normally have a blank column to the left of the function body, as shown in Fig. 6.13. If this is not the case, activate the menu option “View” ⇨ “Stop” (or “Stops”, depending on the IDE). If you are using the Windows IDE, go ahead and deselect the two other options “Trace” and “Monitor” for now.
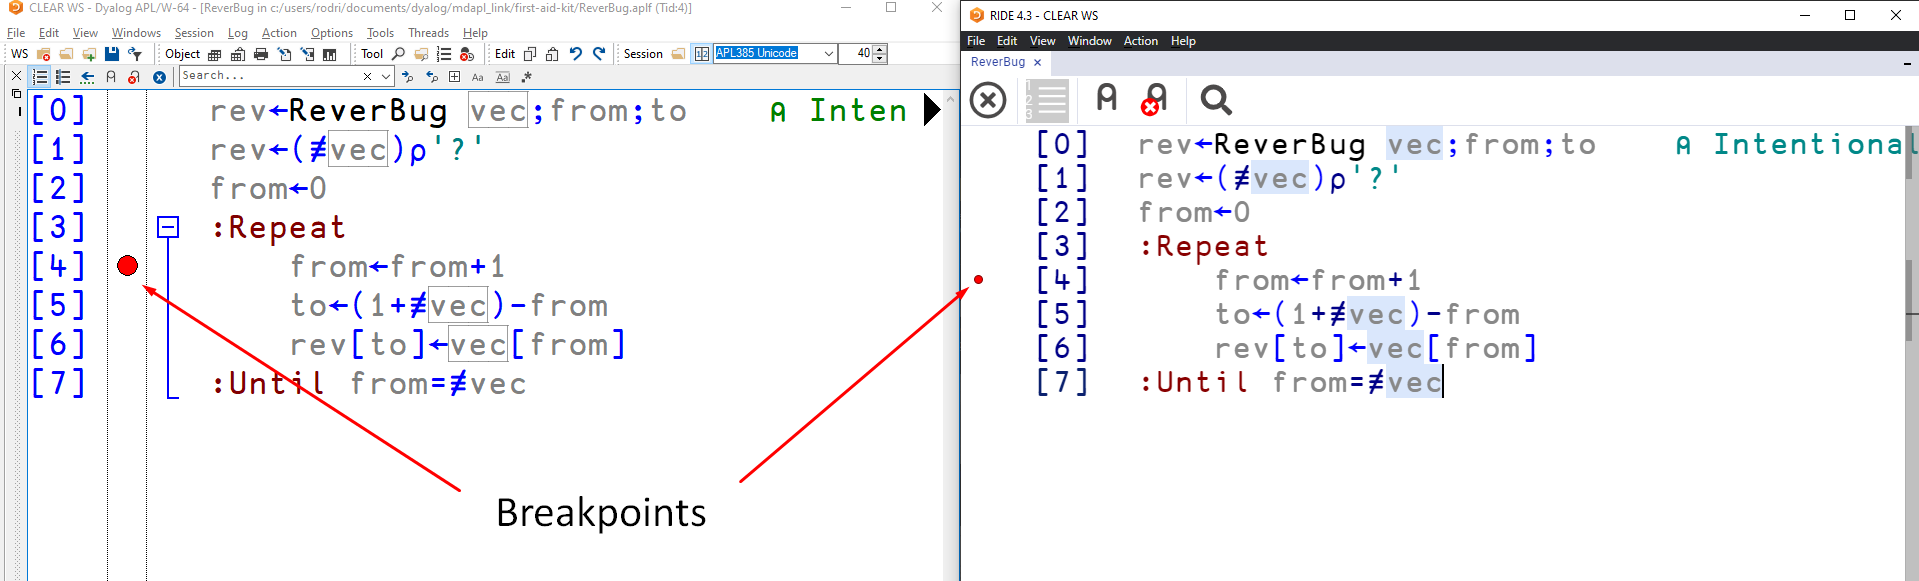
Fig. 6.13 Where to set breakpoints in the two main IDEs.#
You can set or remove breakpoints by clicking in this column, on the line on which you wish to toggle the breakpoint. A red dot shows that the breakpoint is set. You can set and clear breakpoints in edit windows as well as in trace windows, and they can be changed at any time.
When one of the marked functions is executed, it stops before each breakpoint, like it is shown in Fig. 6.14.
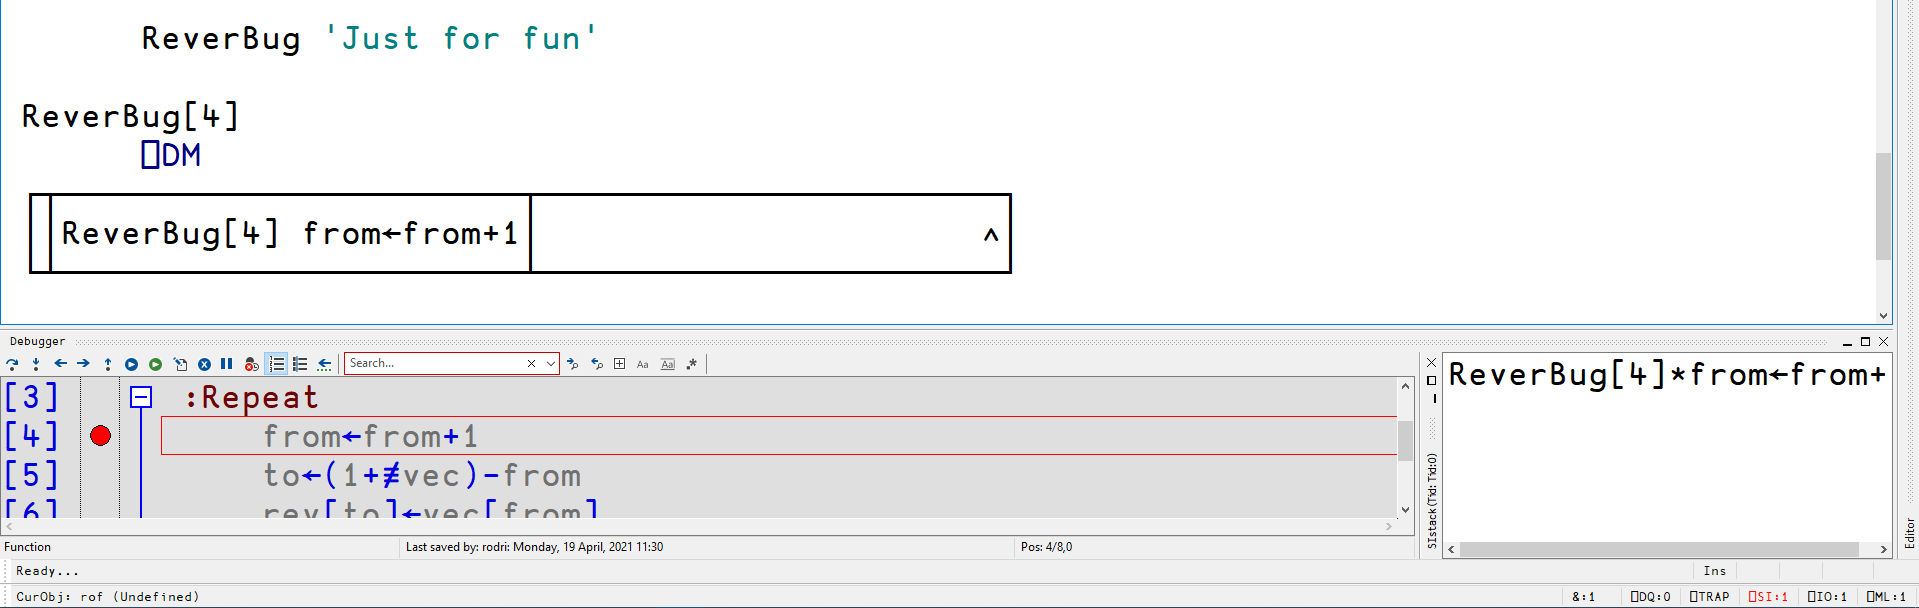
Fig. 6.14 Windows interpreter stops execution right before the first breakpoint.#
Looking at Fig. 6.14, we also see that ⎕DM reports no error, only the statement at which we stopped.
After stopping at a breakpoint you can make all the experiments you need to do, and restart the function at will, in continuous or trace mode.
6.3.3.2. Remove Breakpoints#
Each breakpoint can be removed individually with the mouse, as explained before. But after a long period of testing and debugging, it may be difficult to remember where breakpoints were set, and it is unacceptable to hand over a finished application to the end-user if it contains breakpoints.
For this reason, always remove all the breakpoints by going to “Action” ⇨ “Clear stops” on the Windows IDE and “Action” ⇨ “Clear all trace/stop/monitor” on RIDE. This menu button removes all of the breakpoints from all of your functions, throughout the entire workspace. (On the Windows IDE you can also use the appropriate toolbar icon, which should look the same as the “Clear trace/stop/monitor for this object” button from the trace window.)
6.3.3.3. Programmatically Setting Breakpoints#
Breakpoints can also be set and removed using a system function: lines ⎕STOP 'function'.
Recall the Upper function that returns a string in all uppercase:
Upper 'What is this?'
⎕VR 'Upper'
We can set breakpoints for the lines 2 and 4 if we give the function name to the ⎕STOP system function:
2 4⎕STOP 'Upper'
Now if we run Upper again, it will stop at line 2:
Upper 'What is this?'
Upper[2]
On the Windows IDE or RIDE the trace window should open and you can inspect the variables that are local to Upper that have already been defined.
When you tell the tracer to continue, it will resume execution and then stop at line 4 of the Upper function, because you also set that breakpoint.
If you want to change the breakpoints that are set, just call the function again.
Subsequent calls to ⎕STOP replace the breakpoints that were set previously, so
4⎕STOP 'Upper'
Sets a single breakpoint at line 4.
In the lines ⎕STOP 'function' syntax, notice that
numbers outside the range of available statements are ignored; and
a zero means that a breakpoint will be placed immediately prior to exiting from the function.
Therefore, the line
4 9 0⎕STOP 'Upper'
sets a breakpoint on line 4, then ignores the 9 because Upper only has 6 lines, and 0 sets a breakpoint for immediately before Upper finishes.
The ⎕STOP function returns a shy result indicating the lines in which breakpoints have been actually set:
⎕←4 9 0⎕STOP 'Upper'
The monadic usage of these functions returns the current breakpoints for a function:
⎕STOP 'Upper'
The breakpoints can be removed by specifying an empty vector:
⍬⎕STOP 'Upper'
6.3.3.4. Intentional Interruption#
When an application is running in its normal production context, it is possible that some unexpected circumstances may cause it to crash at an unpredictable point. To cater for this eventuality, it is common practice to set a general error trap, using the techniques described in a later chapter, and halt execution in a controlled manner at a predefined point in the program, so that the developer is able to diagnose and correct the problem.
To deliberately make a function stop under program control, one can use ⎕STOP, or generate an intentional error.
The latter is probably easier, even for a beginner.
There are many ways to do this, but a common one is to jump to a dedicated erroneous statement containing the single character ∘, jot, obtained by pressing Ctrl+j:
∘
SYNTAX ERROR
∘
∧
As you can see above, this symbol alone does not mean anything, so it causes a SYNTAX ERROR. You may encounter this in existing applications.
Another alternative is to type ..., which also raises a SYNTAX ERROR and can also be used inline. Another advantage of using ... is that it is easier to search for with text search tools, because ... is never valid code, whereas ∘ can be used inside statements.
6.3.3.5. Trace-Controls#
Earlier, we saw a very convenient way of tracing functions with the trace window. There is another debugging technique in which functions are executed normally; no trace windows are employed and there is no need to execute statements step by step. To set this up, before execution, the developer sets trace-controls on selected statements in one or more functions. Whenever a line marked by a trace-control is executed, the last value calculated on that line will be displayed in the session, without interrupting execution. Let us explore this technique.
Remark
Bear in mind that this technique only works with tradfns, which is one of the reasons we said tradfns can be easier to debug in Section 5.8.2.
First, in Palindrome, let us replace ReverBug by another looping function, ReverLoop, that is more appropriate for this test:
∇ rev ← ReverLoop vec;letter
rev ← ''
:For letter :In vec
rev ← letter,rev
:EndFor
∇
]dinput
Palindrome ← {
vector ← Upper ⍵
torvec ← ReverLoop vector
torvec≡vector
}
Now we need to set the trace-controls.
If you are using the Windows IDE, you can do this with the GUI or programmatically via the ⎕TRACE system function.
However, if you are using RIDE, you have to do it programmatically.
We cover the two cases here:
Using the Windows IDE GUI, start by opening the edit window of the
ReverLoopfunction and make sure the focus is in the edit window. Go to “View” ⇨ “Trace” and make sure that option is selected. When that option is selected, you get a new blank column in the edit window where you can set yellow markers like Fig. 6.15 shows.
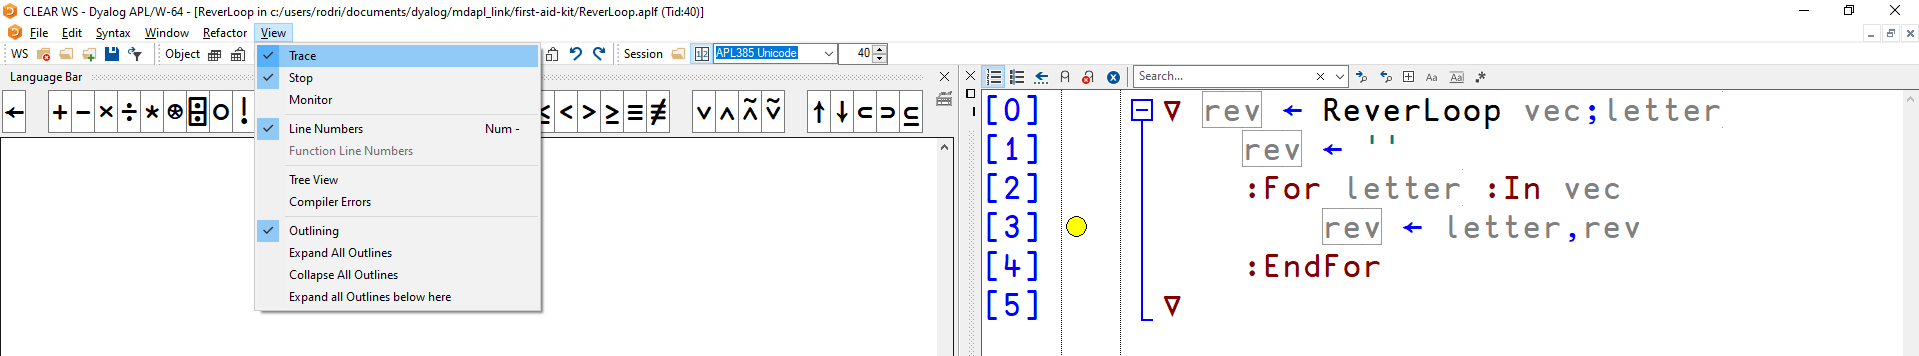
Fig. 6.15 Setting trace controls in the Windows IDE.#
For RIDE, or to set trace-controls programmatically on any platform, you can resort to
⎕TRACEwhich works like⎕STOPdoes:lines ⎕TRACE 'function', wherelinesis a numeric vector containing the lines where you want to set the trace-controls.
If we wanted to programmatically set a trace-control for line 3 of the ReverLoop function, like the yellow marker in Fig. 6.15 shows, we would write the following:
3⎕TRACE 'ReverLoop'
We can now execute the function, and each time the statement of line 3 is executed, Dyalog APL displays the name of the function, the line number, and the last value calculated on that line:
Palindrome 'Boring'
What we can see above is the value assigned to rev every time we loop over a single letter of the vec we feed to ReverLoop.
We said that trace-controls in APL display the last value calculated in the lines where the trace-controls are set.
This can mean different things, depending on the structure of the statement on that line.
For example, in the lines value ← statement and vec[index] ← value, the contents of value would be the thing that gets printed if we set a trace-control for such a line:
∇ vec ← Test ;vec;value
value ← ¯3 + 1 2 3 4 ⍝ [1]
vec ← 10⍴0 ⍝ [2]
vec[3 4 5 6] ← value ⍝ [3]
∇
1 3⎕TRACE 'Test'
Test
As you might imagine, if the traced function(s) perform many loops, this approach may produce pages and pages of output, especially if the results are large. In this case, you will probably most often prefer the previous method.
Trace-controls can be removed in the same way as breakpoints:
using the option under the “Action” menu to clear all stops from all objects in the workspace;
using
⍬⎕TRACE 'function'to remove the breakpoints from a single function; orif you are on the Windows IDE you can also use the appropriate toolbar icon or remove the trace-controls one by one using the GUI of the editor window.
What now?
This is enough for the moment. With a little practice, you should be able to diagnose and correct programming errors.
If you have been using the Windows IDE or if you are eagle-eyed, you might have noticed that the “View” menu allows the user to toggle three different options that are grouped together: trace-controls, breakpoints, and monitors. You will learn about monitors in the Specialist’s section of the chapter on system interfaces.
Also, if you intend to program very professional end-user applications, you must protect your code against unexpected circumstances. This can be done using “Exception processing”, which will be covered in the chapter about event handling, a chapter that complements the present one.
6.4. Exercises#
There are no exercises in this chapter. Enjoy the break!
Fig. 6.16 Beginner APLer struggling with a nail.#
6.5. The Specialist’s Section#
You will find here rare or complex usages of the concepts presented in this chapter, or discover extended explanations which need the knowledge of some symbols that will be seen much further in the book.
If you are exploring APL for the first time, skip this section and go to the next chapter.
6.5.1. Value Errors#
6.5.1.1. Namespaces#
If a VALUE ERROR occurs when you reference a function name, for example GetText, perhaps this function is not “visible” because it is located in a different namespace.
Type the command )obs to see if you have some namespaces and search through them to find the function.
Imagine that GetText exists in a namespace called Files:
Files ← ⎕NS''
Files.GetText ← { 'Here is some text' }
GetText ⍬
VALUE ERROR: Undefined name: GetText
GetText ⍬
∧
You have two ways to execute GetText from the root namespace:
give its full path when calling the function;
Files.GetText ⍬
#.Files.GetText ⍬
set a global path to this namespace then call the function normally.
⎕PATH ← 'Files'
GetText ⍬
6.5.1.2. Nightmare#
You expected to define a function named Travel and wrongly defined a function named west (see Section 6.2.1.1)):
∇ z ← west Traveleast
z ← west-east
∇
If you try to execute west,
west 100
VALUE ERROR: Undefined name: east
west[1] z←west-east
∧
you get a VALUE ERROR on the first statement if east does not exist as a global variable.
But suppose that you do have a numeric global variable named east.
Then the first statement will be executed successfully, and west will call itself recursively, endlessly applying to the same argument (-east), with no exit condition, until the execution stack fills up the workspace.
You will then have an error message like “The current trace stack is 395967 levels deep, etc.”.
In the status field that displays the depth of the state indicator, you will see a high value.
Trying to do anything at this point, even a naked branch, may not work simply because you have run out of workspace, and APL will issue a WS FULL on any attempt to resolve the situation.
Just type )reset to get out of this nightmare, then go and have a strong cup of coffee.
While drinking it, you can think about how you learned to interrupt a function in Section 5.7.7, so that you do not have to wait for the workspace to be eaten up before you can regain control, if (read: when) this happens again.
6.5.1.3. )sinl#
When diagnosing a problem, you generally use )si.
However, you can obtain additional information with )sinl, which also gives all the local names used by the suspended functions, whether or not they have already been calculated.
The nl stands for “name list”.
For example, when Palindrome crashed because our ReverBug implementation had a typo in the expression from ← frm+1, we could have used )sinl:
Palindrome 'Was it a car or a cat I saw?'
VALUE ERROR: Undefined name: frm
ReverBug[4] from←frm+1
                 ∧
)sinl
#.ReverBug[4]* vec rev from to
#.Palindrome[2] vec
Notice that, when the crash occurred, to hadn’t been assigned to yet, but its name is nevertheless reported by )sinl.
This happens because the header of the ReverBug tradfn contains a list of all the local names to ReverBug, where to shows up.
6.5.1.4. Namespaces and Indicators#
6.5.1.4.1. Extended State Indicator#
When a function crashes, the information reported by )si includes the full path to the functions on the execution stack.
This is why all the lines begin with a hash: the root namespace identifier.
For example, suppose that we write a function named MyFile which calls GetText which is located in the namespace Files, and this last function crashes:
      )si
#.[Namespace].GetText[1]*
#.MyFile[0]
      ⎕SI
┌───────┬──────┐
│GetText│MyFile│
└───────┴──────┘
Note that ⎕SI only reports the function names, not the full paths to them.
You can obtain that information using the extended SI, represented by the system function ⎕XSI, as shown:
      ⎕XSI
┌─────────────────────┬────────┐
│#.[Namespace].GetText│#.MyFile│
└─────────────────────┴────────┘
This may help you to open a function in the editor, even if it is being executed in a different namespace using ⎕CS.
For example, you could edit the functions in the stack using ⎕ED ⎕XSI to edit all the functions or using ⎕ED ⊃⎕XSI to edit only the first one.
6.5.1.4.2. Namespace Indicator#
A function located in a namespace can be called from any other namespace.
It may be important to know from where it was called.
This information is given by ⎕NSI.
Let us consider the following scenario:
A workspace contains two namespaces: ToolBox contains some user-defined functions and Files is a Dyalog-provided set of utilities to deal with files, that we can load for our example:
)load Files
The main workspace of the example contains the following function:
∇ r ← Application filename;sink
    sink ← 'Any top level statements'
    r ← #.ToolBox.Control filename
∇
This main program calls Control (located in ToolBox):
'ToolBox'⎕NS''
∇ r ← Control filename;sink
    sink ← 'Any ToolBox statements'
    ⎕CS'#'
    r ← Files.ReadAllText globalPath,filename
∇
⍝ (Ugly) workaround to create the Control function inside its namespace
⍝ when using the Jupyter notebook.
ToolBox.Control ← Control
And on the line before Control calls ReadAllText (located in the Files namespace), it switches execution (it is running in #.ToolBox) to the root namespace (⎕CS'#') in order to execute the expression Files.ReadAllText from #.
When we try to apply the main function to a missing file, an error occurs:
globalPath ← 'c:/tmp/'
Application 'milk.txt'
FILE NAME ERROR: c:/tmp/milk.txt: Unable to open file ("The system cannot find the file specified.")
ReadAllText[3] tn←name ⎕NTIE 0
                       ∧
⎕SI only reports the suspended functions:
      ⎕SI
┌───────────┬───────┬───────────┐
│ReadAllText│Control│Application│
└───────────┴───────┴───────────┘
This is a bit poor, because we cannot see whether or not these three functions are in the same namespace.
However, ⎕XSI and ⎕NSI give us more information:
      ⎕XSI
┌───────────────────┬─────────┬─────────────┐
│#.Files.ReadAllText│#.Control│#.Application│
└───────────────────┴─────────┴─────────────┘
      ⎕NSI
┌─┬─┬─┐
│#│#│#│
└─┴─┴─┘
⎕XSI indicates where each function is located: ReadAllText in Files and Control in ToolBox.
⎕NSI indicates from where each function has been called:
Applicationwas of course executed in the root;Controlwas called byApplicationfrom the root, using its full path; andReadAllTextwas called byControl. But because that function had just executed⎕CS'#', it was running in the root namespace. So,ReadAllTextwas finally called from the root, too.
This explains why the three functions have been called from the root.
The traditional state indicator has also been extended in Dyalog APL:
      )si
#.Files.ReadAllText[3]*
[#] #.ToolBox.Control[3]
#.Application[2]
The [#] before #.ToolBox.Control[3] means there has been a switch to that namespace.
Let us change Control a little so that this function no longer executes its last line in the root namespace (the second statement is commented out).
This needs some minor changes to the third statement so that it can “see” the global names:
∇ r ← Control filename;sink
    sink ← 'Any ToolBox statements'
    ⍝ ⎕CS'#'
    r ← #.Files.ReadAllText #.globalPath,filename
∇
ToolBox.Control ← Control
Of course, the execution fails again, but we now get slightly different information:
      ⎕XSI
┌───────────────────┬─────────────────┬─────────────┐
│#.Files.ReadAllText│#.ToolBox.Control│#.Application│
└───────────────────┴─────────────────┴─────────────┘
      ⎕NSI
┌─────────┬─┬─┐
│#.ToolBox│#│#│
└─────────┴─┴─┘
Nothing has changed in ⎕XSI (the functions are still located in the same places), but now ⎕NSI reports that ReadAllText was no longer called from the root, but was called from ToolBox where Control was executing.
This is also visible in the state indicator:
      )si
#.Files.ReadAllText[3]*
#.ToolBox.Control[3]
#.Application[2]
The [#] has disappeared.